February 14, 2018
When Hurricane Irma hit, responders reached for interactive maps—to see and share a real-time picture, to record storm impacts, to direct responders to those in need, and to mark progress on recovery.
When food-borne illness spreads, growers who map their supply chain from the field to the checkout line can pinpoint the precise part of the field that caused the problem.
When increasing demands for higher speed internet service requires the extension of fiber-optic cables to homes, telecommunication companies use a map to prioritize construction, communicate with crews, and market to consumers.
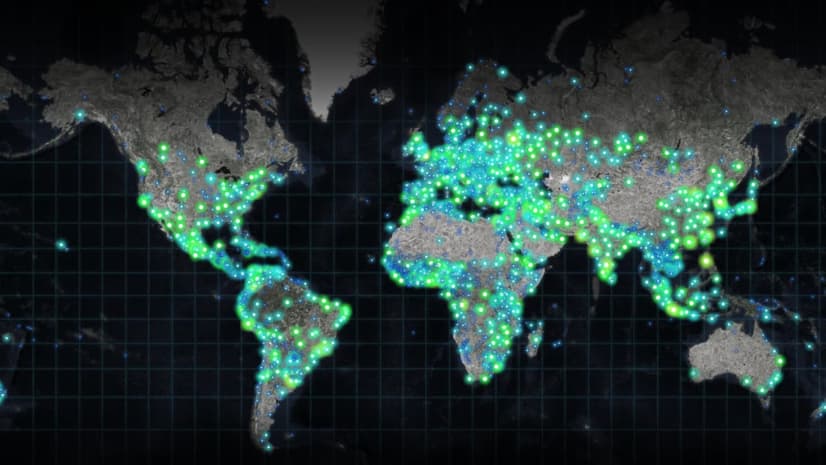
In business or government, when operations require an ‘awhereness’ of quickly changing conditions, today’s smart maps empower quick and authoritative communications.
Growing Coordination
Since ancient times, maps have provided the means to capture knowledge and share information with others in a simple and easily comprehensible way. Maps capture reality using a visual language that communicates understanding, shares perspectives, and encourages participation.
Maps also form the basic unit of information output from a geographic information system (GIS)—providing the canvas for GIS data to be shaped and displayed. Technical advancements and new capabilities of GIS manifest themselves in the way we author and use maps, and how we apply them to problem solving.
In business, maps create competitive advantage, drive growth, and improve efficiency:
In government, maps help cities strengthen operational efficiency, transparency, and constituent engagement:
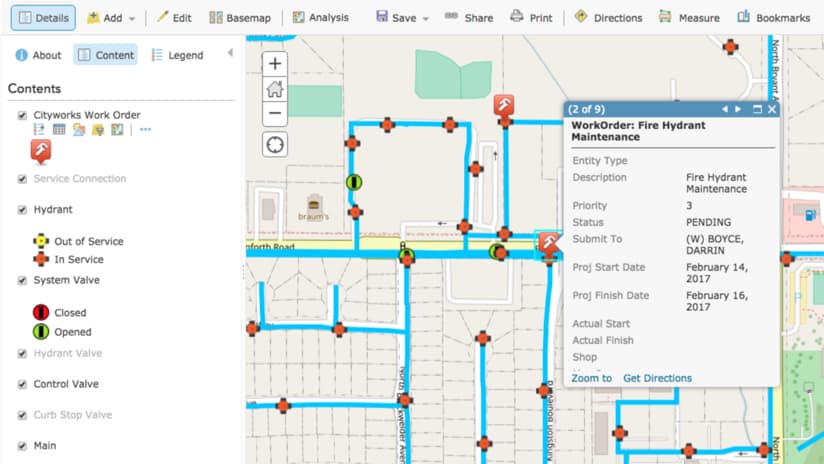
In infrastructure-heavy organizations, smart maps help boost operations and productivity:
Underpinning Advancements
In the same way that video games have progressed in their ability to transport us to imagined worlds due to technology advancements, GIS has progressed in its ability to guide our geographic understanding. Many technologies that underpin GIS have taken leaps forward, leading to dramatic improvements in the speed and capabilities of what and how we model and map.
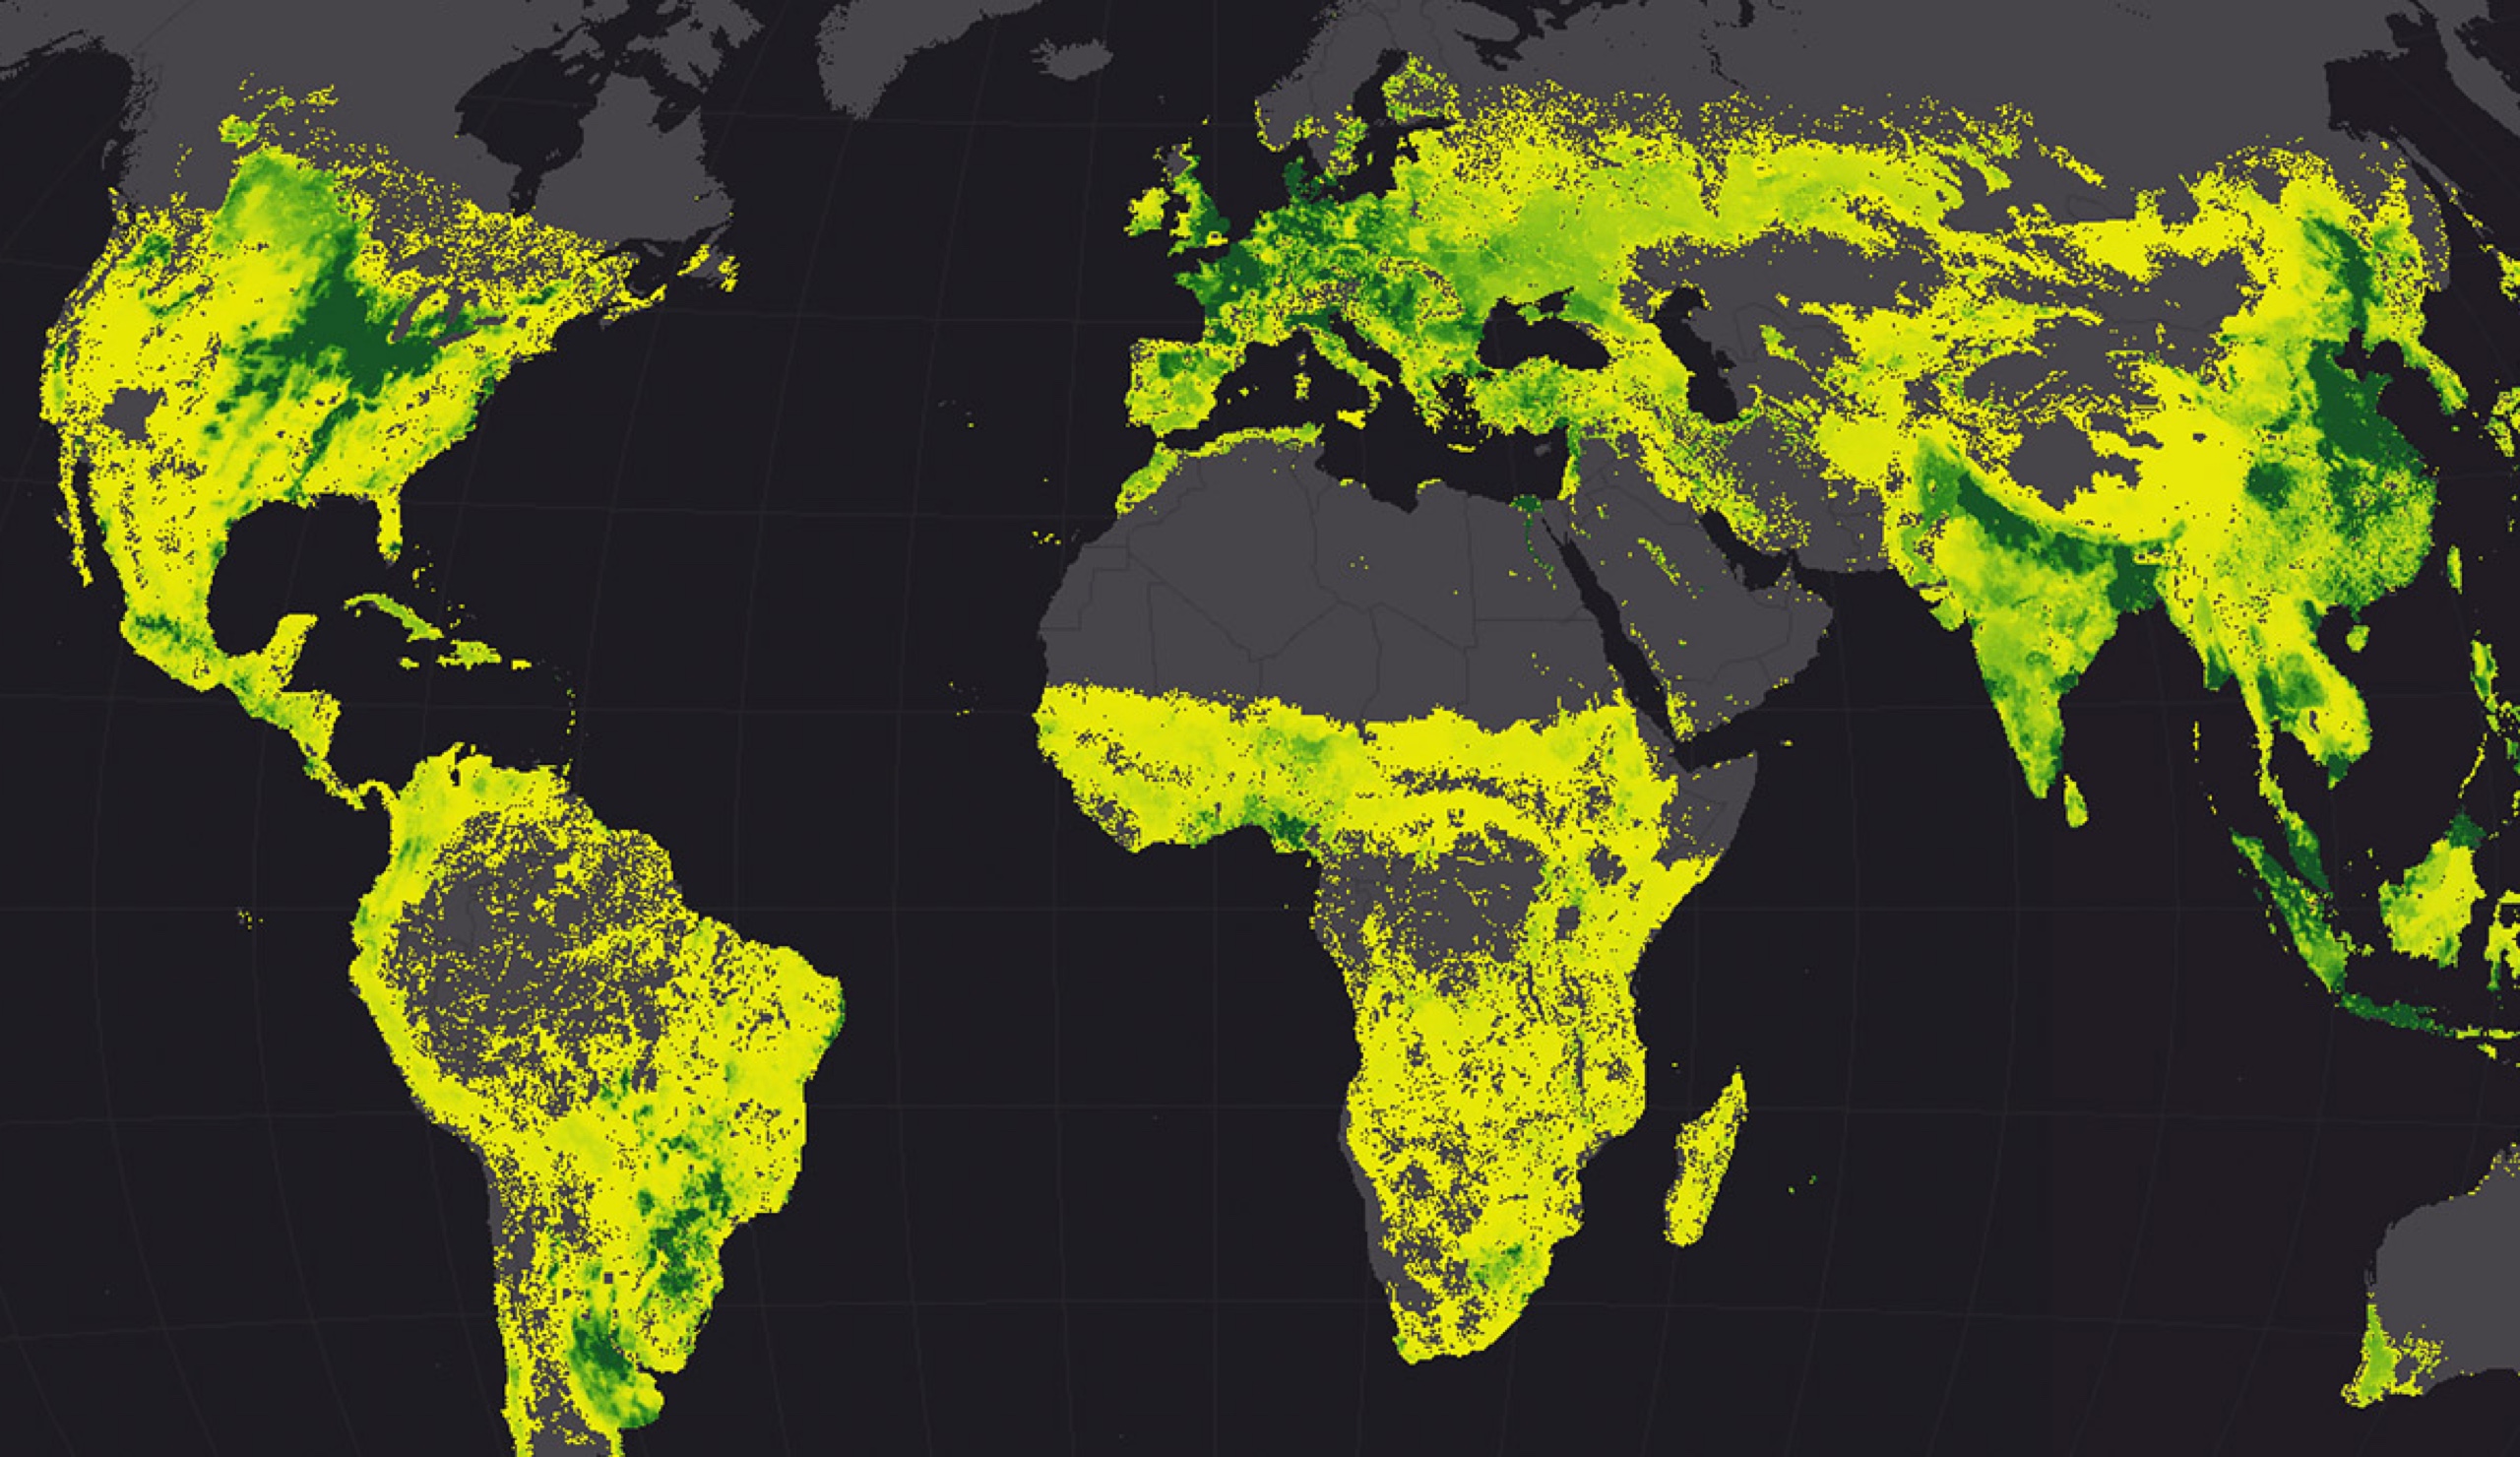
With this framework of technological advancements, GIS users are analyzing larger volumes of data, adding more frequent inputs from sensors, and gaining insight into how the world works. It is not an overstatement to say that GIS now underwrites the discovery and delivery of a new level of understanding about cities, businesses, organizations, and even complex earth systems.
Simple to Complex
At the start, GIS cataloged and mapped what was where. Today’s GIS-powered smart maps provide dynamic displays of information, create ecosystems for interactions, aid real-time awareness and help plan and create the future.
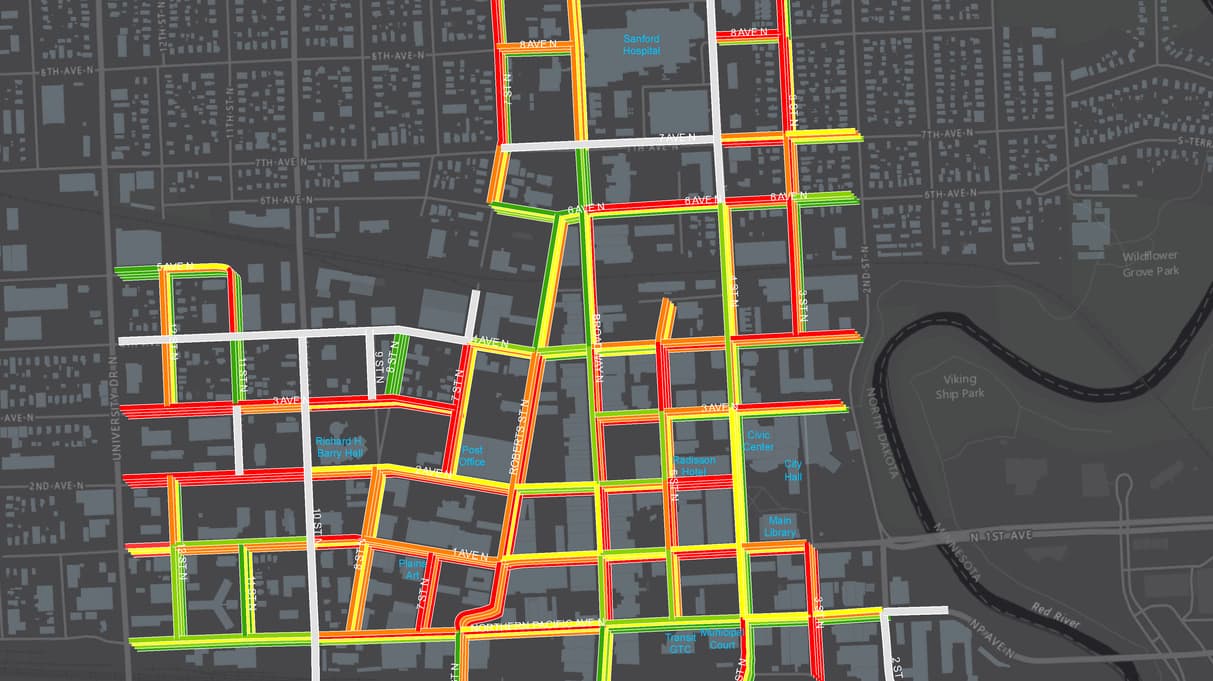
Instead of static displays of information, GIS allows users to amass data about a place and to dig deep to unlock information about people, nature, the built environment, as well as interactions and impacts. Data stores are readily available to detail businesses, profile people, assess ecosystems, and unlock the flow of things—including transportation, waterways, and even commerce. GIS provides the means to tap geographic knowledge and build evidence to support decision making.
Maps in Hands
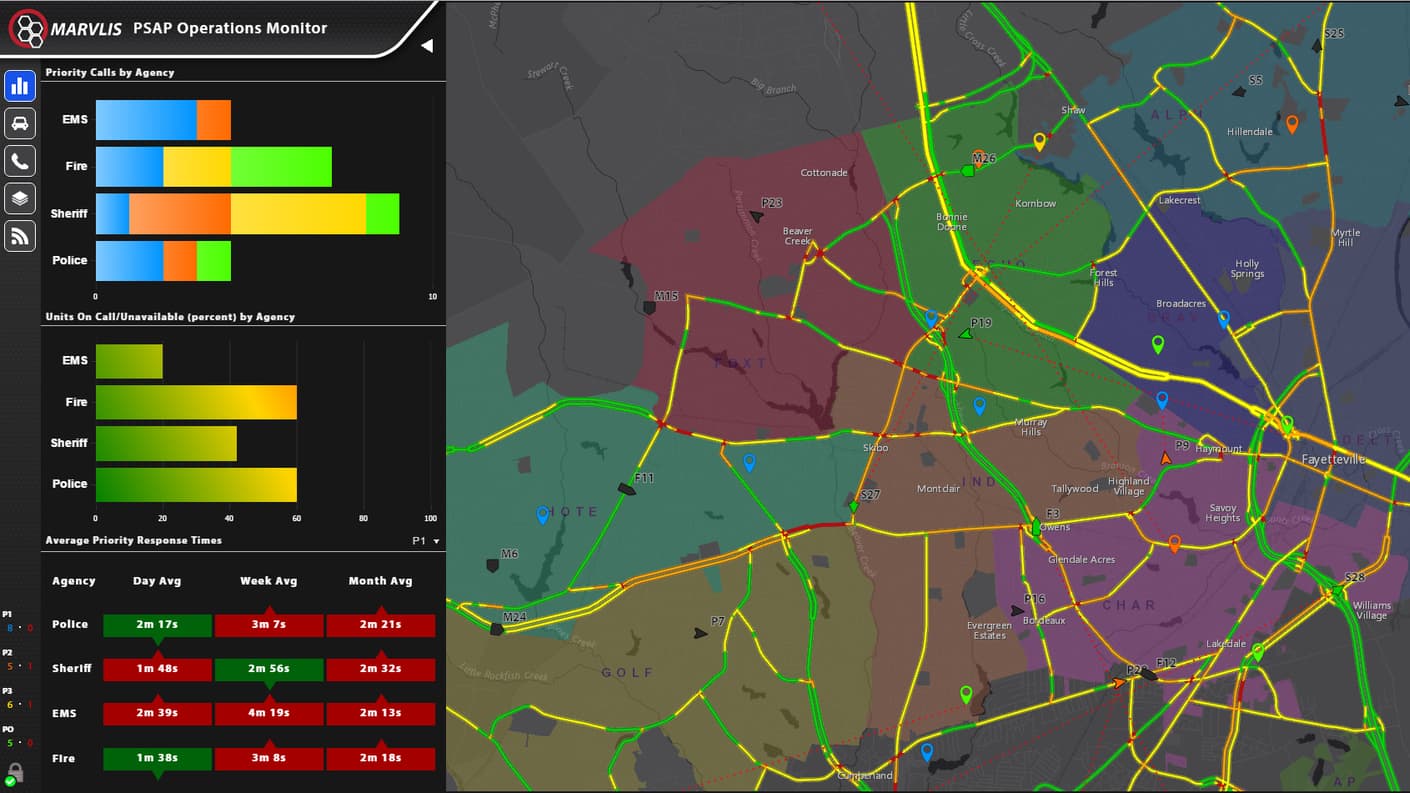
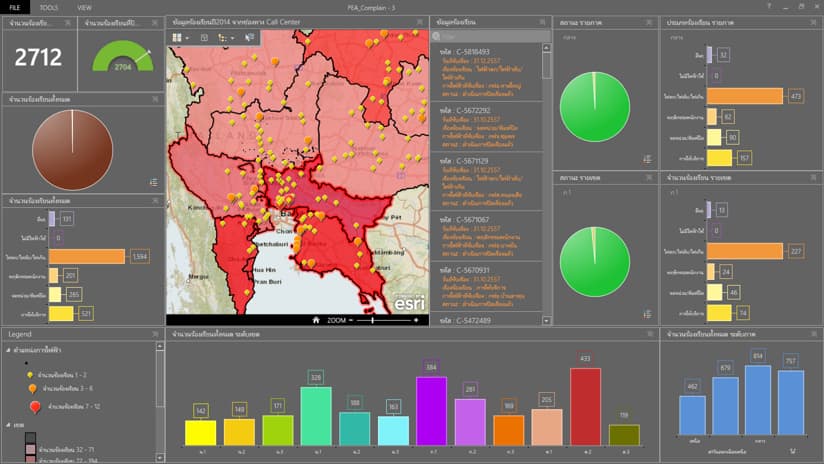
Maps only have power when we put them in the hands of people. As GIS has moved to mobile devices and online, mapping apps have exponentially increased the number of people who use maps. Apps provide the means for personal exploration and input, and the data created within apps feed dashboard views that provide a single comprehensive view for decision makers to monitor interactions, events, and assess daily operations.
As those mapping disasters understand, today’s maps change the way we communicate and collaborate. First responders have transitioned from a series of paper maps to interactive map-based solutions and that has greatly elevated their importance. Today, it’s common for all of the screens in an emergency operation center to display some aspect of the ongoing response via a map, and for every responder to have a map-based app open to record what they see and do. All organizations can benefit from a similar approach for critical tasks—sharing individual perspectives and seeing the work of others—to act in unison to resolve the problem or crisis at hand.
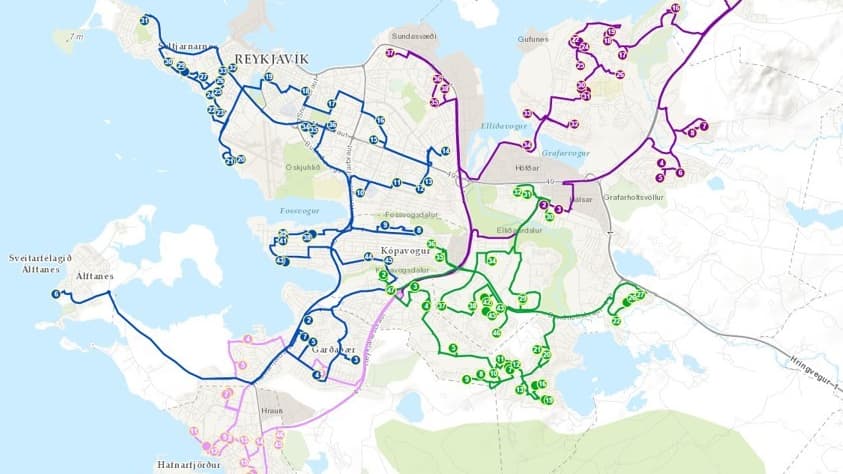
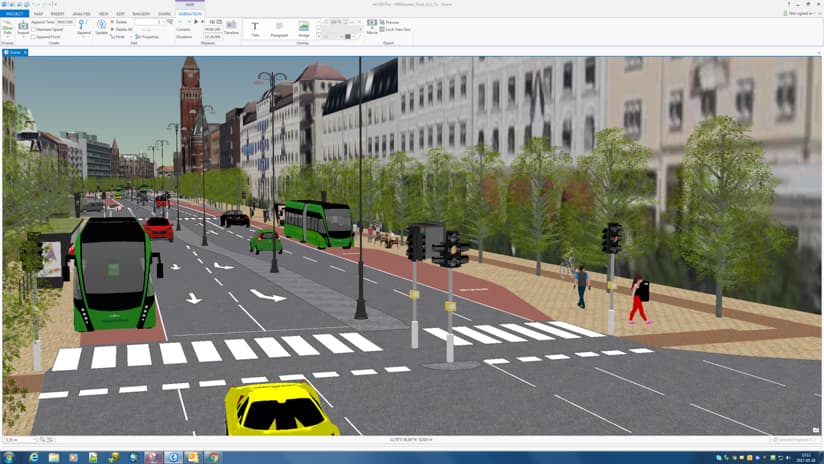
Maps are becoming increasingly dynamic with more inputs from sensors and individuals, leading to improved real-time understanding. Businesses will benefit from empowered field workers that can make quick evidence-based decisions out in the field to improve outcomes thanks to the increased fluidity of information—decisions at the edge. Cities that wrap initiatives around maps and apps provide a common place to inform citizens while also capturing their feedback—increasing constituent engagement. Infrastructure organizations that deploy apps tied to detailed 3D models improve workflows and help eliminate costly delays that result from poor coordination—filling in the gaps.
While spatial analytics provide the next-level of map-based exploration, Dr. Michael F. Goodchild, a noted professor of geography, provides a good summary of why that exploration always starts with a map:
“…analysis does not have to involve complex mathematical operations but begins in the human mind as soon as the map is in view, because the eye and brain are enormously efficient at detecting patterns and finding anomalies in maps and other visual displays.
“GIS works best when the computer and the brain combine forces, and when GIS is used to augment human intuition by manipulating and displaying data in ways that reveal things that would otherwise be invisible.”
Learn how smart mapping makes mapping easier and more impactful.


Geospatial news for executives, managers, and tech professionals
Share feedback and ask questions

